In animal health most days are crazy busy so we really encourage you to pause now and take stock of the patients you have treated in these last 12 months.
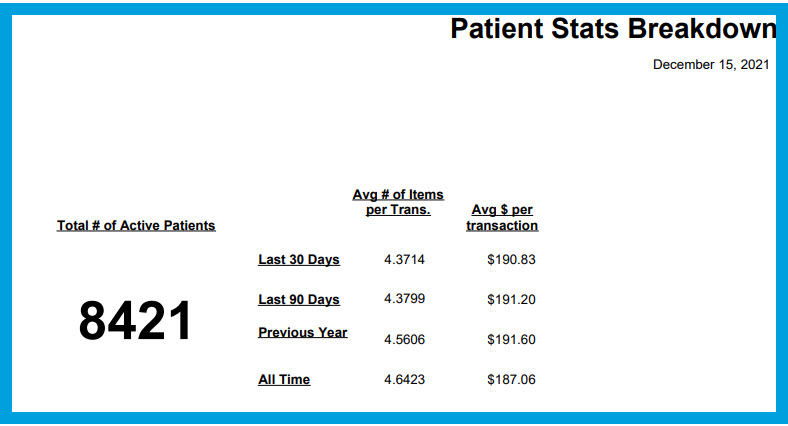
A fantastic place to start is with a high level overview of your patient base. With just one click, the Summary Report - Patient Stat Breakdown will show you how many active patients you have and their average items as well as average dollars per transaction.
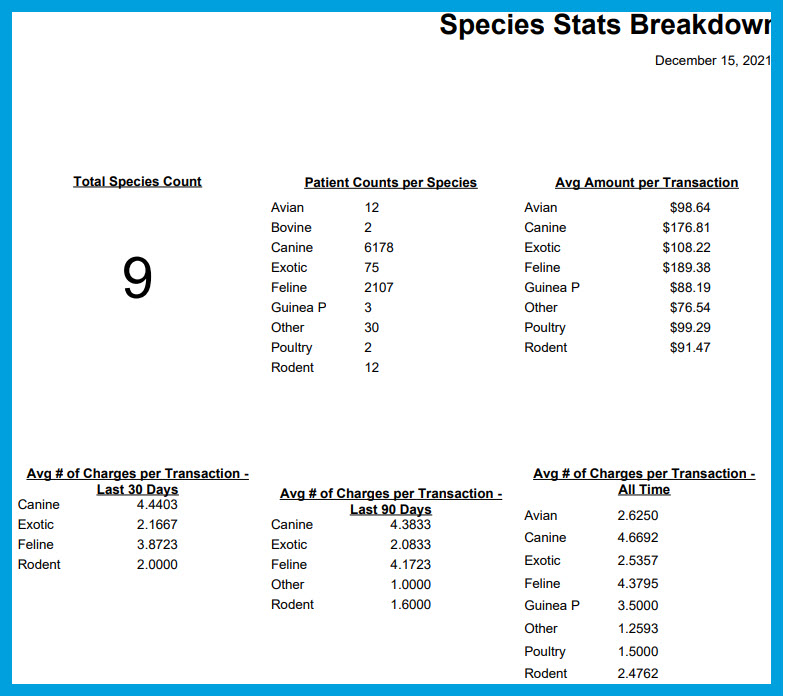
In planning for targeted marketing or new services for 2022 we highly recommend you take a close look at what comprises your active patient base. The Summary Report - Species Stat Breakdown provides the perfect snapshot of how many species you have seen and their spend.
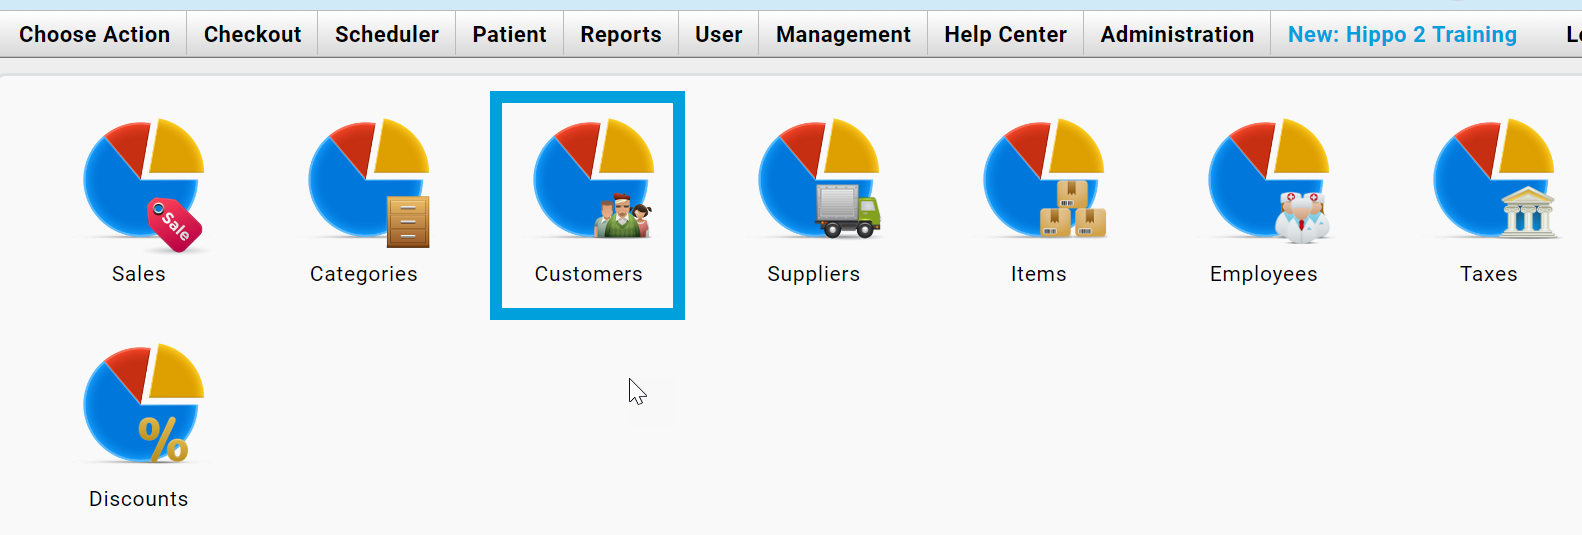
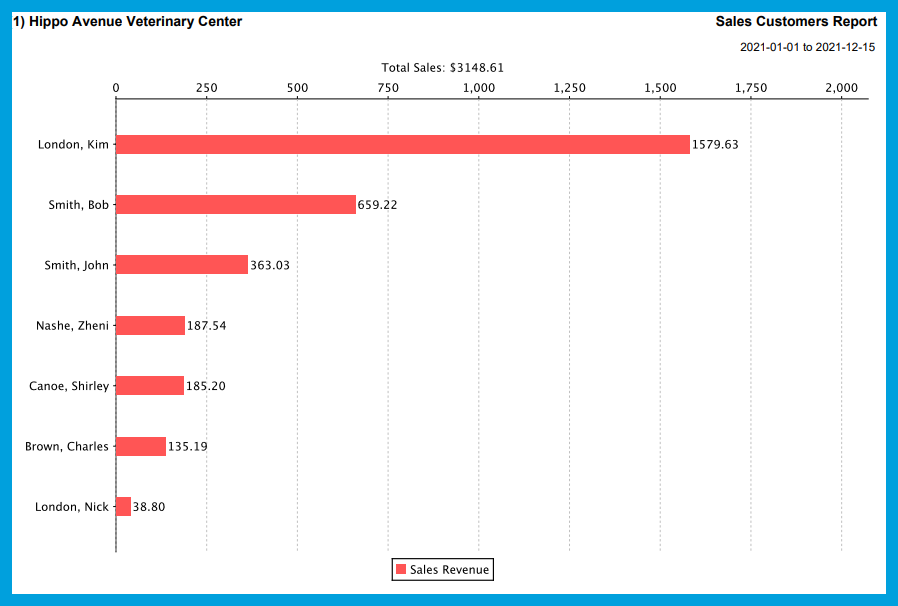
Now let's shift gears to our patient caregivers and identify your top tier clients. The Graphical Report - Customers can be run for the full year and provides an easy to read graph of your top clients as well as their spend. As applicable, this report does display by location and with a summary of all at the end.
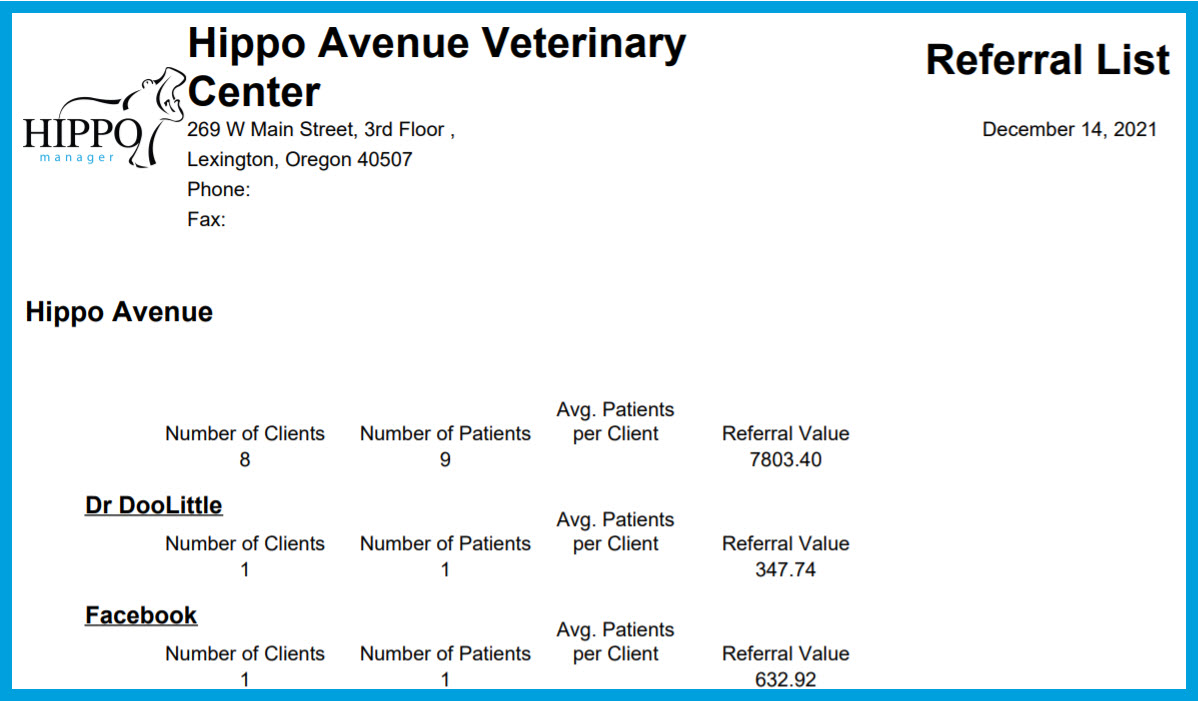
Finally, let's not forget our fabulous colleagues who have helped us out over the course of this past year by referring patients! The Summary Report - Referral List is a really easy way to see who has been referring to you, how many clients they have referred and how much those referred clients have contributed to your practice.

Hope you've enjoyed this foray into reporting, all things patients and clients! Stay tuned for the next installment, all about inventory.
Leave a Comment: